Аннотация
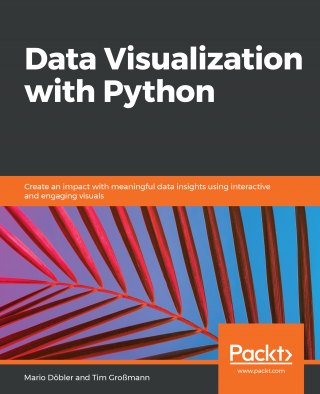
You'll begin Data Visualization with Python with an introduction to data visualization and its importance. Then, you'll learn about statistics by computing mean, median, and variance for some numbers, and observing the difference in their values. You'll also learn about key NumPy and Pandas techniques, such as indexing, slicing, iterating, filtering, and grouping. Next, you'll study different types of visualizations, compare them, and find out how to select a particular type of visualization using this comparison. You'll explore different plots, including custom creations.
After you get a hang of the various visualization libraries, you'll learn to work with Matplotlib and Seaborn to simplify the process of creating visualizations. You'll also be introduced to advanced visualization techniques, such as geoplots and interactive plots. You'll learn how to make sense of geospatial data, create interactive visualizations that can be integrated into any webpage, and take any dataset to build beautiful and insightful visualizations. You'll study how to plot geospatial data on a map using Choropleth plot, and study the basics of Bokeh, extending plots by adding widgets and animating the display of information.
This book ends with an interesting activity in which you will be given a new dataset and you must apply all that you've learned to create an insightful capstone visualization.


![Оглавление
Статьи
После шаттла: космические амбиции Китая Автор: Юрий Ильин
SNIPER: светлое будущее кремниевой нанофотоники Автор: Евгений Лебеденко,... Цифровой журнал «Компьютерра» № 79 [25.07.2011 — 31.07.2011]](https://www.rulit.me/kotha/images/nocover.jpg)


Комментарии к книге "Data Visualization with Python"